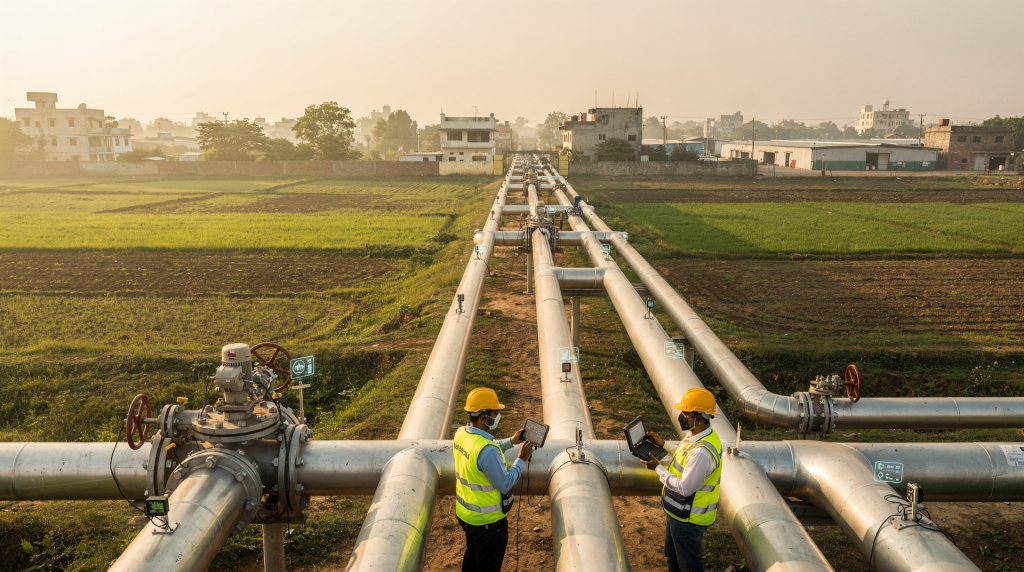
Predictive maintenance shifts pipeline networks from reactive guesswork to proactive, data-driven management. It spots early signs of trouble—pressure drift, abnormal vibration, creeping flow changes—long before they turn into leaks, bursts, blockages, or service shutdowns. In Indian residential townships, where water, gas, and sewage systems often combine municipal supply, on-site storage, and internal distribution, this approach helps operators keep services stable by using real-time data, alert thresholds, and condition-based repairs instead of waiting for a resident to report a problem.
Why pipeline reliability matters in townships
A township’s utility network is only as reliable as its weakest segment. One failed valve, a clogged sewer line, a leaking joint, or an unstable pump can affect entire blocks, interrupt daily life, and trigger expensive emergency work. I’ve seen a single air valve malfunction on a water main cause pressure collapse across three buildings during peak morning demand—something that could have been avoided with basic monitoring.
In India, this matters even more because many residential projects depend on a mix of legacy municipal supply, on-site storage, pumping, treatment, and internal distribution. That creates more handover points, more equipment, and more chances for small faults to grow into service failures. A typical township might have borewell pumps, overhead tanks, booster pumps for high-rise blocks, and a sewage pumping station—all interconnected. Without condition monitoring, a pump bearing that runs hot for weeks goes unnoticed until it seizes, and suddenly an entire wing has no water.
Predictive maintenance reduces that risk by turning the network into a monitored system rather than a blind one. It gives operators a continuous health check on the assets that residents rely on every day.
What predictive maintenance means in simple terms
Predictive maintenance is a strategy that uses live or near-live data to estimate when a component is starting to degrade and needs attention. Instead of replacing parts on a fixed calendar or waiting for a failure, the operator acts when the data shows abnormal behavior. Think of it like a doctor reading vital signs rather than waiting for a heart attack.
In pipeline networks, the data often comes from:
- Pressure readings
- Flow rates
- Pump vibration
- Temperature changes
- Energy use
- Water quality indicators
- Tank levels
- Valve status
- Alarm history
The core idea is simple: if a pipeline or asset starts behaving differently from its normal pattern, maintenance can be scheduled before the issue becomes visible to residents. For example, a gradual increase in pump current draw over a month might indicate impeller wear or clogging, allowing a planned intervention during low-demand hours instead of a midnight breakdown.
How it improves reliability
1. It catches leaks and pressure loss earlier
A slow leak may not be obvious at first—no water on the surface, no dramatic pressure drop. But it often causes subtle pressure decay, abnormal flow patterns, or repeated pump cycling. In Indian townships where water supply is intermittent (often only a few hours a day), pressure monitoring during supply windows is critical. A drop of 0.2 bar in a high-rise booster line might be the only hint of a pinhole leak that, left unattended, erodes pipe bedding and leads to a major burst. For gas systems, pressure irregularities can signal unsafe conditions or equipment stress; a 2 mbar drift in a residential PNG network may indicate a regulator issue or a small leak, and early detection is vital for both safety and uptime.
2. It reduces unplanned shutdowns
Traditional maintenance often follows one of two patterns: fix it after it breaks, or replace it on a rigid schedule. Both can be inefficient. I’ve seen perfectly good pump seals replaced every six months “because that’s the schedule,” while a failing check valve was ignored until it caused water hammer damage. Predictive maintenance helps utilities work between those extremes by servicing the asset when condition data says it is needed. That usually means fewer emergency shutdowns, shorter repair windows, and less disruption for residents—no more Sunday morning surprises when the sewage pumps trip.
3. It extends asset life
Pumps, valves, meters, sensors, and treatment equipment wear out faster when faults are left unchecked. Vibration, heat, misalignment, clogging, and abnormal loading all shorten life over time. When operators identify these issues early, they can correct the cause rather than repeatedly patching the symptom. For instance, a slight misalignment in a pump-motor coupling increases vibration and bearing wear. Predictive data catches the vibration trend, allowing realignment before bearing failure. That improves the useful life of critical assets and slows expensive replacement cycles—a big deal when a single vertical turbine pump for a 500-unit complex costs several lakh rupees.
4. It improves response time
In a connected system, alarms can be routed to operators immediately, and the location of the issue can be matched to mapped asset records. That reduces the time spent searching for the problem and speeds up dispatch and repair. For large townships, this is especially valuable because the difference between a quick response and a delayed response can determine whether an issue stays local or spreads across multiple buildings. I recall a case where a sewage level sensor alarm allowed the team to clear a blockage in 20 minutes; without it, the backup would have flooded a basement parking area by the time anyone noticed.
5. It supports better compliance and safety
Predictive maintenance is not only about cost savings. It also supports compliance, safety, and operational traceability. Monitoring pressure, flow, and asset health helps teams document that the network is being operated within safe limits. This is important in India, where infrastructure projects often need to balance engineering quality, municipal coordination, and long-term operation by facility teams or resident associations. When a gas pipeline pressure is continuously logged and stays within the 21–25 mbar range, it’s easier to demonstrate compliance to safety auditors and to the residents themselves.
The tools behind predictive maintenance
Predictive maintenance works best when several technologies are combined. Here’s how they fit together in a typical township setup:
| Tool | What it does | Why it matters |
|---|---|---|
| Sensors | Measure pressure, flow, vibration, temperature, or quality | Provide live condition data from the field—without them, you’re blind |
| SCADA | Central control and monitoring system | Lets operators see and manage the network remotely, often from a single screen |
| IoT devices | Collect and transmit field data | Improves visibility across distributed assets, especially in sprawling townships |
| Analytics | Detect patterns and anomalies | Identifies abnormal behavior before failure—turns raw data into actionable insight |
| Digital twins | Virtual model of the physical network | Helps test scenarios and plan interventions without touching the real system |
| GIS mapping | Shows where assets are located | Speeds fault location and maintenance planning; critical when a valve is buried under a landscaped area |
In practical terms, these systems work together: sensors observe, software interprets, and maintenance teams act. A pressure drop detected by a sensor on a water main is picked up by SCADA, flagged by analytics as an anomaly, and the operator sees it on a map with the exact valve location—all within seconds.
Where predictive maintenance is most useful
Water supply networks
It helps detect leakage, pump inefficiency, pressure fluctuations, valve issues, and tank-level anomalies. In a typical Indian township with overhead tanks and booster pumps, monitoring tank fill cycles and pump run times can reveal hidden leaks or failing foot valves long before residents complain of low pressure.
Gas distribution networks
It helps monitor pressure stability, asset stress, and leak risk, while improving safety response and traceability. In residential PNG networks operating at low pressure (around 21 mbar), even a 1–2 mbar deviation sustained over an hour can indicate a regulator fault or a slow leak. Continuous monitoring with trend analysis is far more reliable than periodic manual checks.
Sewer and wastewater systems
It helps identify pump problems, rising levels, blockage trends, and abnormal operating conditions before overflow or backup occurs. Sewage pumps in a township’s collection sump often run intermittently; if the pump starts cycling more frequently or the wet well level rises faster than normal, it may signal a downstream blockage or pump wear. Catching that early prevents the all-too-common sight of sewage overflowing from a manhole during morning hours.
Common utility assets in townships
It is especially useful for pumps, booster systems, storage tanks, treatment units, valves, meters, and network junctions that support many residents at once. A single booster pump failure in a high-rise can leave 50 families without water; predictive vibration and temperature monitoring on that pump is a small investment against a big liability.
Predictive maintenance vs preventive maintenance
| Approach | How it works | Main limitation |
|---|---|---|
| Reactive maintenance | Fix after failure | Highest disruption and risk; residents are the alarm system |
| Preventive maintenance | Service on a fixed schedule | Can replace parts too early or too late; wastes money or misses failures |
| Predictive maintenance | Service based on condition data | Needs sensors, data quality, and skilled monitoring—but pays back in reliability |
Predictive maintenance is usually the most efficient option for critical networks, but it depends on good data and disciplined operations. Without those, it’s just an expensive dashboard.
What can go wrong if it is not done properly
Predictive maintenance is powerful, but only if the underlying system is built and managed well. I’ve seen projects where expensive sensors were installed, but nobody calibrated them, and the SCADA screen became a gallery of nuisance alarms that operators learned to ignore.
Common failure points include:
- Poor sensor placement—measuring the wrong parameter or at the wrong location
- Low-quality or incomplete data—gaps in logging that hide trends
- Lack of calibration—drift that makes readings meaningless over time
- Siloed systems that do not share data—the pump controller doesn’t talk to the SCADA
- Weak alert thresholds—set too wide, missing real issues; too narrow, causing alarm fatigue
- No trained staff to act on alarms—a dashboard without a response plan is just decoration
- No asset map or updated records—knowing a pump is failing is useless if you can’t find it quickly
If the network data is unreliable, the system may generate false alarms or miss real faults. In that case, predictive maintenance becomes noise instead of intelligence, and the maintenance team goes back to reacting to complaints.
Practical checklist for township operators and buyers
For operators and facility teams
- Verify that major pumps, tanks, and network branches are monitored—at minimum, pressure and level sensors on critical nodes
- Check whether pressure and flow data are logged continuously, not just sampled once a day
- Confirm that alarms have clear escalation rules: who gets the alert, within what time, and what action is expected
- Review maintenance history for repeated failures—if the same pump bearing fails every eight months, look upstream
- Ensure assets are mapped accurately in GIS or equivalent records, with tag numbers matching the SCADA database
- Calibrate sensors on a fixed schedule—at least annually for pressure transmitters, more often for water quality probes
- Track response time from alarm to repair; if it’s consistently over two hours for a water supply fault, the process needs tightening
For homebuyers evaluating a township
- Ask whether water, gas, and sewage systems are monitored, and what parameters are tracked
- Ask how leaks, pressure drops, and pump failures are detected—look for specific answers, not generic “we have sensors”
- Review whether the project has a planned maintenance system or only emergency repairs; request a sample maintenance log
- Check if common utility assets have service logs and whether those logs show trend analysis or just reactive fixes
- Ask who owns and operates the utility network after handover—is it a professional facility management firm or the resident association?
- Confirm whether the association or operator has technical staff or a qualified contractor with experience in automated systems
- Enquire about gas pressure monitoring: is there continuous logging, and what is the normal operating range for the network?
- For water, ask about supply hours and whether pressure is guaranteed at the topmost floor; a well-monitored system can provide this data
Signs a project may already use predictive maintenance well
A well-run network usually shows these traits:
- Stable water pressure across most blocks, even during peak demand
- Fewer recurring pump or valve failures—you don’t hear about the same problem every quarter
- Fast identification of faults—residents may not even notice a brief pressure dip because the team fixed it proactively
- Clear maintenance logs that show condition-based work orders, not just time-based replacements
- Metered utility usage and anomaly tracking—unusual consumption patterns are investigated, not ignored
- Documented alarm handling with timestamps and resolution notes
- Lower frequency of emergency repair calls, and when they happen, the response is swift
If the operator cannot explain how faults are detected before residents notice them, the maintenance system may still be mostly reactive. A simple test: ask to see the last three predictive alerts and what was done about them. If there’s no record, the system is likely not functioning as intended.
Implementation steps that actually work
Step 1: Identify critical assets
Start with the components that can affect many users at once: pumps, mains, storage tanks, treatment units, and critical valves. In a township, the sewage lifting station and the main water booster set are usually the highest priority—failure there cascades quickly.
Step 2: Install the right sensors
Do not monitor everything blindly. Focus on data that reflects real failure modes: pressure, flow, vibration, temperature, and tank levels. For a water pump, vibration and current draw are often more useful than flow alone. For a gas regulator, outlet pressure is the key parameter.
Step 3: Build a reliable asset map
Every asset should have a location, tag, and service history. GIS-linked records make repairs faster and reduce confusion during emergencies. When a valve needs to be closed at 2 a.m., the team should have a map showing exactly where it is, not a hand-drawn sketch from memory.
Step 4: Set meaningful thresholds
Thresholds should reflect normal operating conditions, not generic values copied from another project. A booster pump that normally draws 15 amps might have an alarm at 17 amps, but if the impeller is wearing, the current may creep up slowly. Setting a trend-based alert on the rate of change is often more effective than a fixed limit. Poor thresholds produce false alarms or missed warnings.
Step 5: Assign responsibility
A dashboard is useless if nobody owns the response. Define who receives alerts, who investigates, and who approves shutdowns or repairs. In a township, this could be the facility manager during the day and a designated on-call technician at night. Without clear ownership, alarms are acknowledged and forgotten.
Step 6: Review patterns, not just alarms
The biggest value often comes from trend analysis. Repeated minor deviations may reveal a deeper issue long before a hard failure occurs. For example, a gradual increase in the daily start-up time of a sewage pump might indicate a growing blockage downstream. Weekly reviews of trend charts catch what individual alarms miss.
Typical mistakes to avoid
- Treating predictive maintenance as a software purchase instead of an operating process—the tools are only as good as the people using them
- Installing sensors without a response workflow—data without action is overhead
- Ignoring calibration and data validation—sensors drift, and dirty data leads to bad decisions
- Using too many alarms with no priority ranking—if everything is critical, nothing is
- Focusing only on equipment, not on records and operating discipline—a well-documented reactive system can sometimes outperform a poorly-run predictive one
- Assuming a new system is reliable without testing real failure scenarios—simulate a sensor failure or a communication loss to see if the system degrades gracefully
Why this matters for Indian residential projects
In India’s growing township market, reliability is not just about convenience. It affects property value, resident satisfaction, operating cost, and long-term handover quality. I’ve seen well-engineered townships where poor maintenance led to chronic water shortages and sewage overflows, eroding trust and triggering legal disputes. Predictive maintenance changes that equation.
A township with predictive maintenance is usually better prepared for:
- Water shortages or pumping instability—tank levels and pump health are continuously watched
- Sewer overloads after heavy use or rainfall—early warning from level sensors prevents spills
- Gas safety monitoring and pressure control—ensuring the network stays within safe limits
- Faster repairs with less resident disruption—because the fault is located and diagnosed before the team arrives
- Lower long-term operating risk—fewer catastrophic failures mean predictable budgets and stable service
Conclusion
Predictive maintenance improves pipeline network reliability by turning utility systems into monitored, data-driven assets. For Indian townships, that means earlier fault detection, fewer failures, safer operation, and more stable service for residents. When it is paired with accurate mapping, disciplined maintenance, and trained operators, it becomes one of the most effective ways to protect water, gas, and sewer infrastructure over the long term. The key is to start with the assets that matter most, instrument them sensibly, and build a culture where data drives decisions—not just a collection of gadgets.
FAQ
Is predictive maintenance only for large industrial pipelines?
No. It is especially valuable in large residential townships where many users depend on the same shared utility network. A 1,000-unit complex has enough critical assets to justify the investment, and the cost of failure is measured in resident inconvenience and reputation.
Does predictive maintenance replace regular maintenance?
No. It improves maintenance planning, but inspections, calibration, cleaning, and routine servicing are still necessary. Predictive data tells you when to do certain tasks, but it doesn’t eliminate the need for hands-on upkeep like greasing bearings or flushing strainers.
What is the biggest advantage for a homeowner?
The biggest advantage is fewer unexpected service disruptions, especially in water supply, sewer operation, and gas safety-related systems. You’re less likely to wake up to no water or a foul smell from a backed-up sewer, and that peace of mind is tangible.
What data matters most?
Pressure, flow, vibration, temperature, energy use, and alarm trends are among the most useful signals for pipeline reliability. For water networks, pressure and tank levels are primary; for gas, pressure and flow; for sewage, pump status and wet well levels.
Can predictive maintenance prevent all failures?
No. It reduces risk, but it cannot eliminate every failure. Random events like a power surge or a sudden pipe fracture due to external damage may still occur. Its effectiveness depends on data quality, sensor coverage, and how quickly the operator responds. It’s a powerful tool, not a magic shield.